GIS based analysis of violence and crime: towards a geography of violence/crime
Written by: dr. Nikola Šimunić
Crime is any action that constitutes an offense as defined by the criminal law of the country, and that is punishable by law. A crime involves an offense, one or more offenders, and one or more victims (who may be individuals, or may be communities) (Haining, 2017). Singer, Kovčo Vukadin and Cajner Mraović (2012) consider that geographical aspects of crime are relatively low existent in modern criminology. The study of crime overlaps many areas of the social sciences with different disciplines tending to focus on different questions, such as: Where is a crime committed? Is there any correlation between crime and spatial features of the researched area? Is there an analogy between spatial patterns of areas with similar crime rates?
Violence is the intentional use of physical force or power, threatened or actual, against oneself, another person, or against a group or community that either results in or has a high likelihood of resulting in injury, death, psychological harm, maldevelopment, or deprivation (World Health Organization – WHO). Violence is described as a public health problem and calls for a public health response to violence prevention and reduction (World report on violence and health, 2002). It has many forms and contexts, like youth violence, intimate partner violence, child abuse or sexual violence. It has implications far beyond the victim and perpetrator of violence. Criminological aspect considers violence as purposely or accidentally provoked feeling of fear or insecurity (Derenčinović and Getoš, 2008). That fact qualifies violence as one of the research objects in criminology.
Geography, by its definition, is a field of science devoted to the study of the lands, features, inhabitants, and phenomena and their interactions in a spatial context.
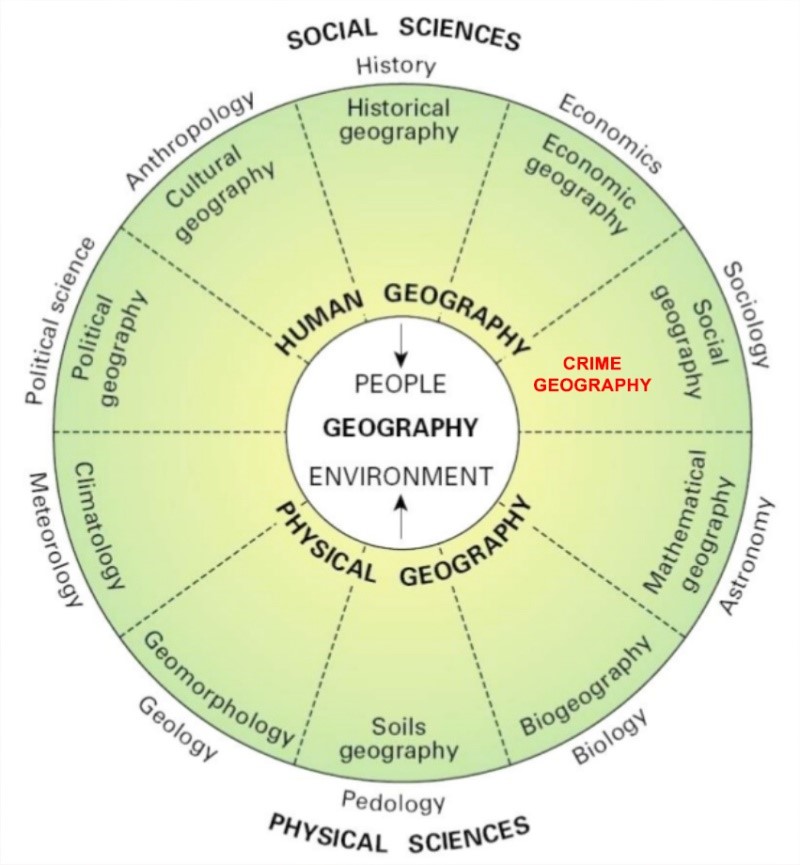
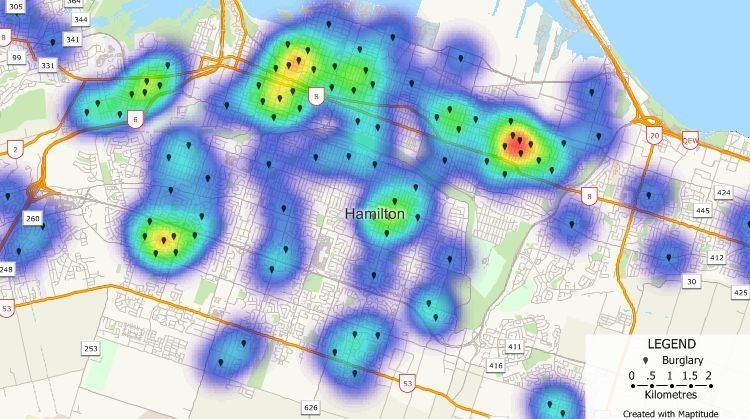
Geography is often defined in terms of two branches: human geography and physical geography. Human geography pertains to the study of people and their communities, cultures, economies, and interactions with the environment by studying their relations with and across space and place (Figure 1). One of the research interests of human geographers is crime. When a crime occurs, it happens at a place with a geographical location (Chainey and Ratcliffe, 2005). In that context, crime mapping has a significant role in crime research. There is a toolset that strongly connects geography and criminology – GIS. A geographic information system (GIS) is a computer system for capturing, storing, querying, analyzing, and displaying geospatial data (Chang, 2018). One of many applications of GIS is crime analysis with mapping as data visualisation tool. GIS is a major innovation for police organizations, enabling crime analysts, intelligence officers, uniformed officers, detectives, and command staff to improve the effectiveness of day-to-day work of law enforcement and crime prevention. The innovation stems from high-powered visualization of crime patterns on maps and unique spatial processing of crime data for analysis (Gorr, Kurland and Dodson, 2018). Therefore, there are opportunities for using GIS more and in a better way, with stronger integration to crime reduction strategies both in the forces themselves and as a part of the wider crime-and-disorder partnerships. A good example of GIS implementation in crime analysis is the Crime Map Analyst tool with its functionalities (Brindley, Craglia, Haining and Kim, 2008). Chainey and Ratcliffe (2005) state that crime mapping will become as much an essential tool of criminological research as the statistical analysis is at present. Crime mapping has enabled many police forces to add value to their routinely recorded crime and service-call data by helping to identify and empirically quantify high-risk locations (crime hotspots) where additional resources might be targeted (Haining, 2017). Among crime maps, there is a global popularity of (crime) hot spot maps that identify locations with high crime concentrations that police command staff use to target police patrols for crime prevention. Crime analysts have a range of methods to predict crime hot spots (Gorr, Kurland and Dodson, 2018). Crime is concentrated at very small geographic units of analysis, such as street segments or small groups of street blocks (Figure 2.). Such crime hot spots offer stable targets for police interventions (Braga, 2017).
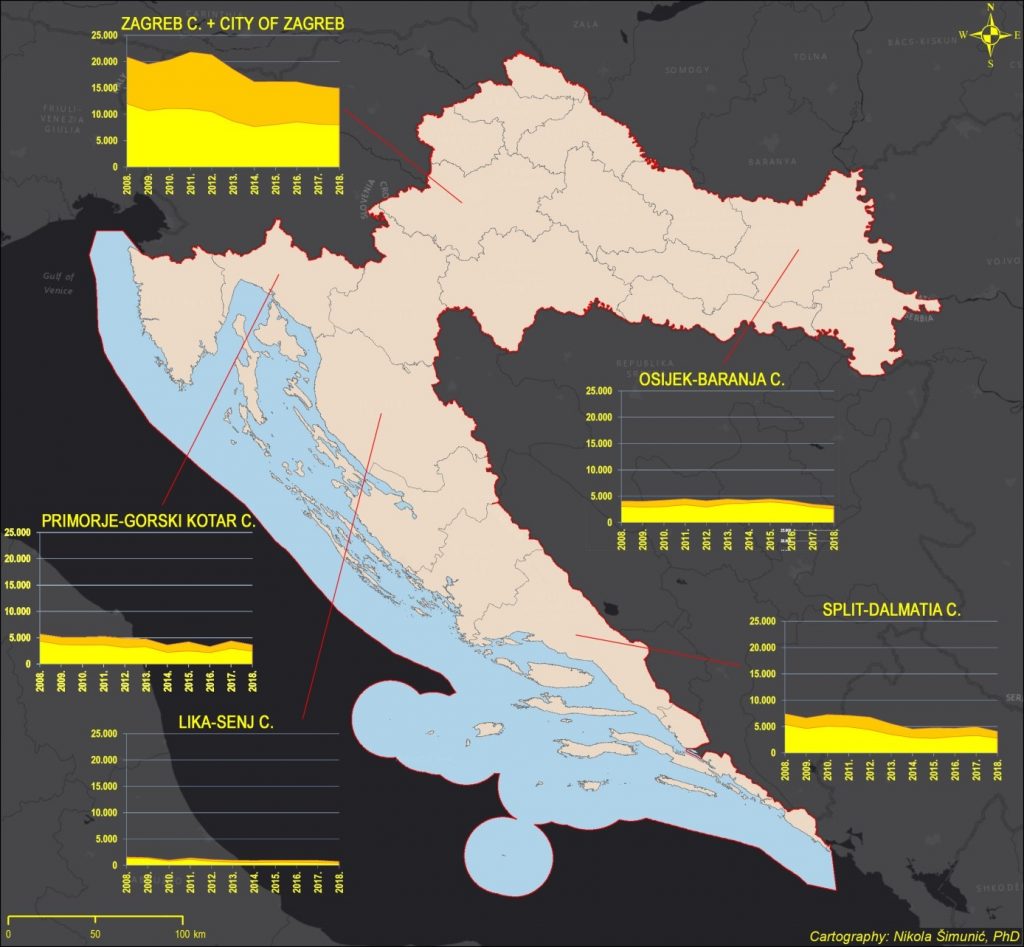
The study of the geography of crime has a long history, stretching back to the early nineteenth century. After a quiescent period in the middle of the twentieth century, it has now again become a field of strong research activity (Bottoms, 2014). Geography of crime/violence is not being institutionalised in Croatia yet, even though there are several significant research that have been conducted in the past several years. Croatia, like many other countries in Southeastern Europe, does not seem to have a “conventional crime problem” and does not fit in the profile of a “high crime region” when compared to the rest of Europe (Getoš Kalac and Karlović, 2014). National distribution of crime can be observed through the number of committed offenses. In the period 2008 – 2018, there were 707,150 registered offenses, of which 448,975 was resolved (63.5%) [source]. The highest ratio of registered offenses was recorded in Zagreb County (28.5%), while the lowest ratio was recorded in Požega-Slavonia County (1.0%). The highest ratio of resolved offenses was also recorded in Zagreb County (23.3%), while the lowest ratio was recorded in Požega-Slavonia County (1.3%) (Figure 3.).
A better indicator of crime distribution (and police efficiency) is a crime rate. A crime rate describes the number of reported crimes per 10,000 total population. The highest crime rate of registered offenses was recorded in Istria County (3054.3), while the lowest ratio was recorded in Krapina-Zagorje County (985.3). The highest rate of resolved offenses was also recorded in Lika-Senj County (1864.3), while the lowest rate was also recorded in Krapina-Zagorje County (776.8).
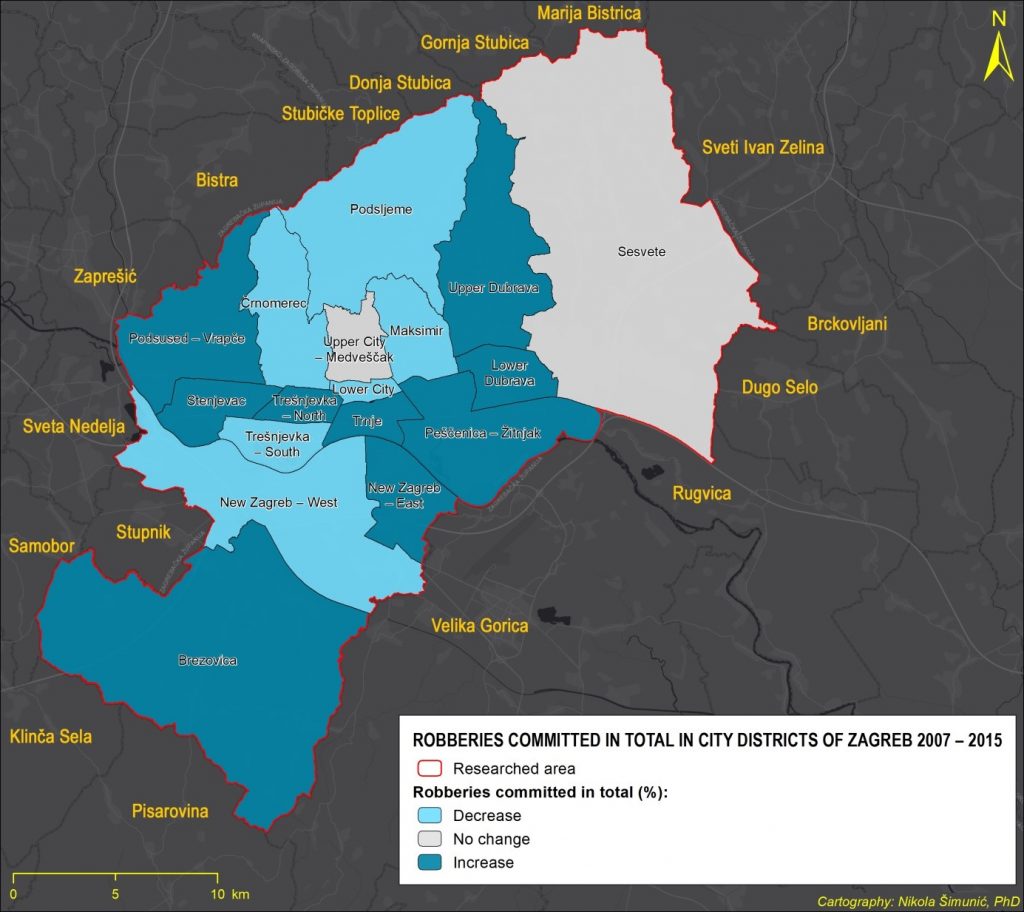
Crime and violence can be analysed on various scales – global, macroregional – national – microregional – local. From the “geocriminological” point of view, it is possible to analyse numerous aspects of crime in spatial-temporal aspects (Figure 4). There is no doubt that GIS will pave the way to more complex and more advanced analysing of spatial processes and temporal trends connected with the crime.
References:
Bottoms, A. (2014). Geography of Crime. In G. Bruinsma and D. Weisburd (Eds.), Encyclopedia of Criminology and Criminal Justice (pp. 1943–1956). Amsterdam: Springer.
Braga, A. A. (2017). Hot Spots Policing: Theoretical Perspectives, Scientific Evidence, and Proper Implementation. In B. Teasdale and M. S. Bradley (Eds.), Preventing Crime and Violence (pp. 269–279). Cham: Springer.
Brindley, P., Craglia, M., Haining, R. P. and Kim, Y-H. (2008). Crime Map Analyst: A GIS to Support Local-Area Crime Reduction. In S. Wise and M. Craglia (Eds.), GIS and Evidence-Based Policy Making (pp. 113–131). Boca Raton: CRC Press.
Chainey, S. and Ratcliffe, J. (2005). GIS and crime mapping. Chichester: John Wiley & Sons, Ltd.
Chang, K-T. (2018). Introduction to Geographic Information Systems, 9th ed. New York: McGraw-Hill Education.
Derenčinović, D. and Getoš, A-M. (2008). Uvod u kriminologiju s osnovama kaznenog prava. Zagreb: Pravni fakultet Sveučilišta u Zagrebu.
Getoš Kalac. A-M. and Karlović, R. (2014). Criminology and Crime in Croatia. In A-M. Getoš Kalac, H-J. Albrecht and M. Kilchling (Eds.), Mapping the Criminological Landscape of the Balkans: A Survey on Criminology and Crime Landscape of the Balkans (pp. 139–174). Berlin: Duncker and Humbolt.
Gorr, W. L., Kurland, K. S. and Dodson, Z. M. (2018). GIS Tutorial for Crime Analysis, 2nd ed. Redlands: ESRI Press.
Haining, R. (2017). Crime. In D. Richardson, N. Castree, M. F. Goodchild, A. Kobayashi, W. Liu and R. A. Marston (Eds.), The International Encyclopedia of Geography (pp. 1–8). Chichester: John Wiley & Sons, Ltd.
Karlović, R., Sučić, I., Babić, J. and Šimunić, N. (2018). Spatial and temporal analysis of robberies – a case study of Zagreb, Croatia. Unpublished.
Singer, M., Kovčo Vukadin, I. and Cajner Mraović, I. (2002). Kriminologija, 4th ed. Zagreb: Nakladni zavod Globus, Edukacijsko-rehabilitacijski fakultet Sveučilišta u Zagrebu.
Statistical overview of basic safety indicators and results of work (2018), Zagreb: Ministry of the Interior. Available at: [source] Accessed: 17th November 2019.
World report on violence and health (2002). Editors: E. G. Krug, L. L. Dahlberg, J. A. Mercy, A. B. Zwi and R. Lozano. Geneva: World Health Organization. Available at: [source]. Accesed: 17th November 2019.